Sales Metrics

Sales Metrics and why you need a cohesive strategy
CRM without a well-defined strategy is bound to fail.
Few teams within an organization are as data-driven as your sales team. Each and every activity is measurable, and your challenge is often knowing what to track.
Sales analytics is the practice of generating insights from sales data, trends, and metrics to set targets and forecast future sales performance. The best practice for sales analytics is to closely tie all activities to determining revenue outcomes and for setting objectives for your sales team.
Analysis should focus on improvement and developing a strategy for improving your sales performance in both the short- and long-term. A common example of a sales analytics activity is setting role-specific objectives for your team in the form of KPIs or metrics. For instance, setting a revenue target for your sales director while setting a sales productivity goal for your account management team.
Why monitor sales analytics?
If your business was a rock band, sales would be the lead singer. All eyes are on sales and revenue performance, and a strong (or weak) performance can become a potent rallying force for your entire team.
Where CRM plays a critical role
Monitoring sales analytics in the form of sales metrics helps increase your performance, optimize sales activities, and improve accountability. Your sales team has a wide range of activities to focus on and operate in a fast-paced environment. A well-defined sales analytics strategy provides your team with focus and clarity so they can concentrate on doing what they do best.
Sale analytics reports and dashboards
Data transparency when it comes to sales analytics is tricky. Many members of your team lack the training required needed to do ad-hoc reporting and management, let alone understand how this is tied back to company strategy.
Some questions you need to ask about your business
These are just a few of the questions that can be answered by the correct implementation of a CRM system
- What does it cost to acquire a new customer?
- What is my Close Rate/Hit Rate per product/product group, Sales Person, Region ?
- Why are you loosing orders, Price/Availability/Customer loyalty/ installed base?
- What is my GP per product/product group, Sales Person, Region?
- How many visits/telephone calls does it take to get a new customer?
- How many visits/telephone calls does it take to close an order?
- What does a customer cost us Calls, Visits, Support load, late payments?
- What is the return on investment for Events, Adverts, Digital?
- How many leads turn into orders, what is the TRUE cost per lead?
- How are Accounts / Support departments affecting sales?
- How efficient are your sales reps?
- Who is the DMU (Decision Making Unit) in each customer, and are we maximizing touchpoints?
Some of the Key Metrics that should be delivered from your CRM
Sales Growth
Sales analysis revolves around your ability to grow revenue. A small blip in your trend line will do more than furrow brows, it’ll have your team digging through the data for definitive answers.

Sales Target
This KPI tracks current performance against a business objective. Sales may be represented as revenue, a number of accounts, units sold, or any other measure that is relevant for your team.

Lead conversion Rate
Insights like lead conversion rates help keep sales and marketing teams aligned throughout the customer journey. Conversion analytics allows for teams to continuously optimize performance to steadily improve customer experience.
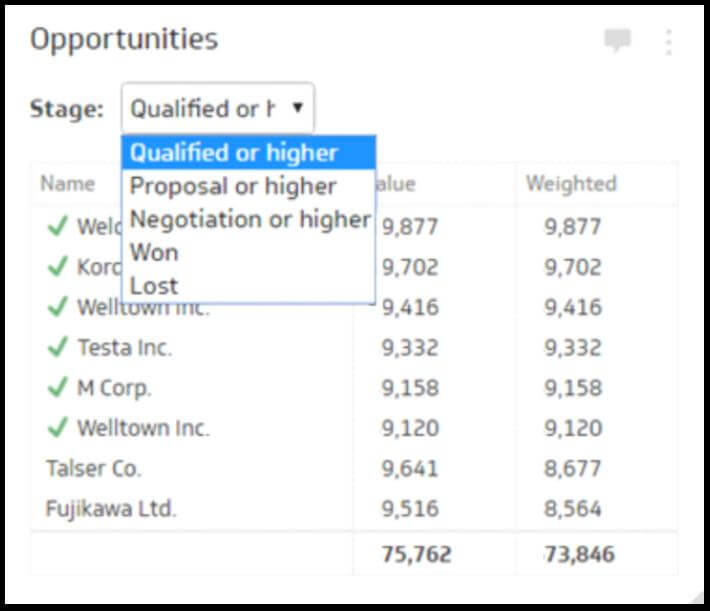
Opportunities
In a perfect world, you’d be able to prioritize your sales efforts based on the likelihood to close. Barring the sudden appearance of a crystal ball, your current opportunities is the best way to track and measure that.
Cost of ownership per customer
What does each customer cost you to service compared to the revenue they generate. Understanding this helps with decisions on customer retention strategy.

Sales to Date
Perform rapid analysis by comparing your current sales against the previous period, the same period the previous year, and get a sense of historical trends.

Product Performance
For teams selling multiple products and with targets for each product, it’s important to track sales for each line.

Sell-through rate
If you’re selling physical goods, tracking your sales versus the total inventory is an important analytics undertaking. It will inform your supply-chain and help in sales forecasting.

Cannibalization rate
A new product to sell may be exciting, as innovation often is, but sometimes it can adversely impact sales for an existing product. By tracking product cannibalization in your sales analytics, you can better manage customer experience.
Quote-to-Close
Quote-to-close is an excellent sales productivity metric because it demonstrates how effective your team is at closing a deal. This metric gives analysis into the quality of leads and the quality of your sales process.

Average Purchase Value
One of the most effective ways to increase sales revenue is to increase the average purchase value of each sale. Incorporating this metric into your analysis and to track historical trends is a smart strategy.

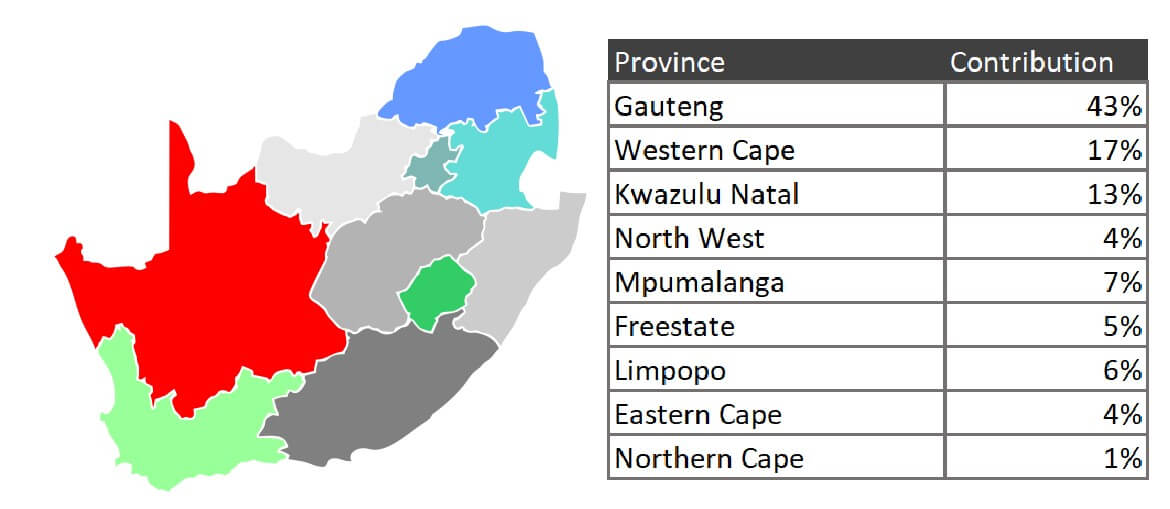
Sales by Region
Even global businesses will find they have regional differences in sales and revenue. Tracking this metric will give visibility into the territories in which you are competitive and profitable.